Why You Shouldn't Rely Too Much on PageSpeed Insights
A 95 on PageSpeed Insights does not mean your site is fast for real users, and a 60 does not mean it is slow. Here is why the score is only part of the picture and what to use instead.
Jacob Almogela
Full Stack Developer
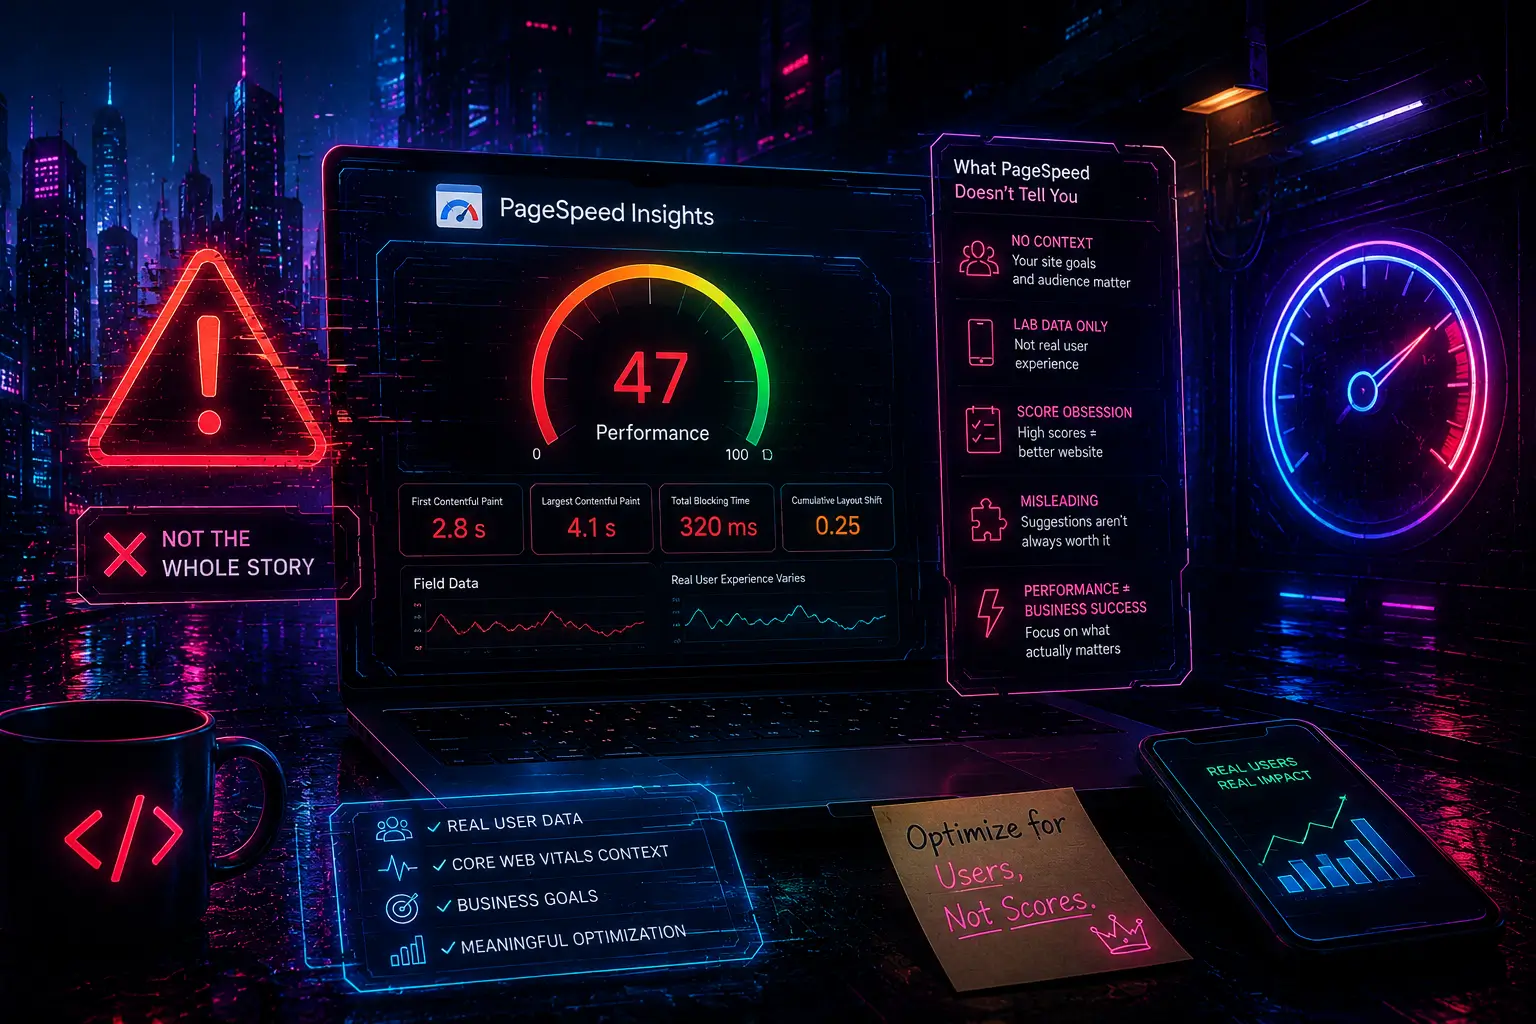
If you have ever refreshed PageSpeed Insights three times and gotten three different scores, you already know something is off. One run gives you 74. The next gives 81. The one after that gives 68. Nothing changed on your site. So what is going on and should you even care about the number?
What PageSpeed Insights Actually Measures
PageSpeed Insights runs a Lighthouse audit against your URL using a simulated environment: throttled to a slow 4G connection and emulated mid-range Android hardware. It then scores your page based on weighted lab metrics like LCP, CLS, TBT, FCP, and Speed Index. The result is a single number from 0 to 100.
The problem is that number is extremely sensitive to conditions that have nothing to do with your code. Server response time at the moment of the test, CDN cache state, third-party scripts phoning home, and Google's own testing infrastructure load all affect the result. That is why the same page scores differently every time you run it.
PSI scores vary because the test environment is simulated, not your real server under real conditions. A single score is a snapshot, not a verdict.
The Internet Speed Problem
The biggest misconception about PageSpeed Insights is that the score reflects your users' actual experience. It does not. It tests on a throttled slow 4G connection regardless of where your actual users are or what connection they are on. A business site whose audience is mostly office workers on fiber broadband will look slow on PSI because PSI does not test on fiber. It tests on emulated slow mobile data.
Your users in Manila on a fast LTE connection, or your clients in Belgium on 200 Mbps fiber, are not experiencing the site the way PSI measures it. The throttling is intentional. It is meant to catch worst-case performance. But it means a score of 65 on PSI can still translate to a perfectly snappy experience for your actual audience.
Lab Data vs Real User Data
PSI actually shows two types of data if your site has enough traffic. Lab data from the Lighthouse simulation, and field data from the Chrome User Experience Report also known as CrUX. The field data is collected from real Chrome users visiting your site. It reflects actual connection speeds, actual devices, and actual geographic locations.
- ◆Lab data (Lighthouse score) — simulated, repeatable, useful for debugging specific issues
- ◆Field data (CrUX) — real user measurements, aggregated over 28 days
- ◆Field data is what Google actually uses as a ranking signal — not your lab score
- ◆If you have no field data yet, PSI only shows lab results — which is even less reliable
This distinction matters a lot for SEO. Google's Core Web Vitals ranking signal is based on CrUX field data, not your Lighthouse score. You could have a Lighthouse score of 55 and still pass Core Web Vitals if your real users are actually experiencing fast loads.
So What Should You Use Instead?
Use WebPageTest for deep analysis. It lets you choose the exact test location, real browser, real connection type, and number of runs. It shows a full waterfall chart so you can see exactly which resources are blocking render, how long DNS takes, when the first byte arrives, and what third-party scripts are costing you. Run it from the same country as your target audience for results that actually mean something.
For ongoing monitoring, check Google Search Console under Core Web Vitals. This shows your real field data aggregated by page group. If your field data is green, you are good, regardless of what your lab score says on any given day.
When PSI Is Still Useful
Do not throw PSI away entirely. It is a useful diagnostic tool when you are looking for specific issues like render-blocking scripts, unoptimized images, missing lazy loading, or large layout shifts. Run it, look at the Opportunities and Diagnostics sections, fix the real issues it flags, and ignore the overall score as a KPI. The score is a tool, not the goal.
Focus on fixing what PSI flags in Opportunities and Diagnostics, not on chasing the number. A 10-point score increase that does not improve real user LCP is meaningless.
The bottom line: use PageSpeed Insights to find problems, use WebPageTest to understand them deeply, and use Google Search Console field data to know if your real users are actually having a good experience. The score is a starting point, not the finish line.