Table of Contents
Web Debugging Tools: The Essential Guide for Developers
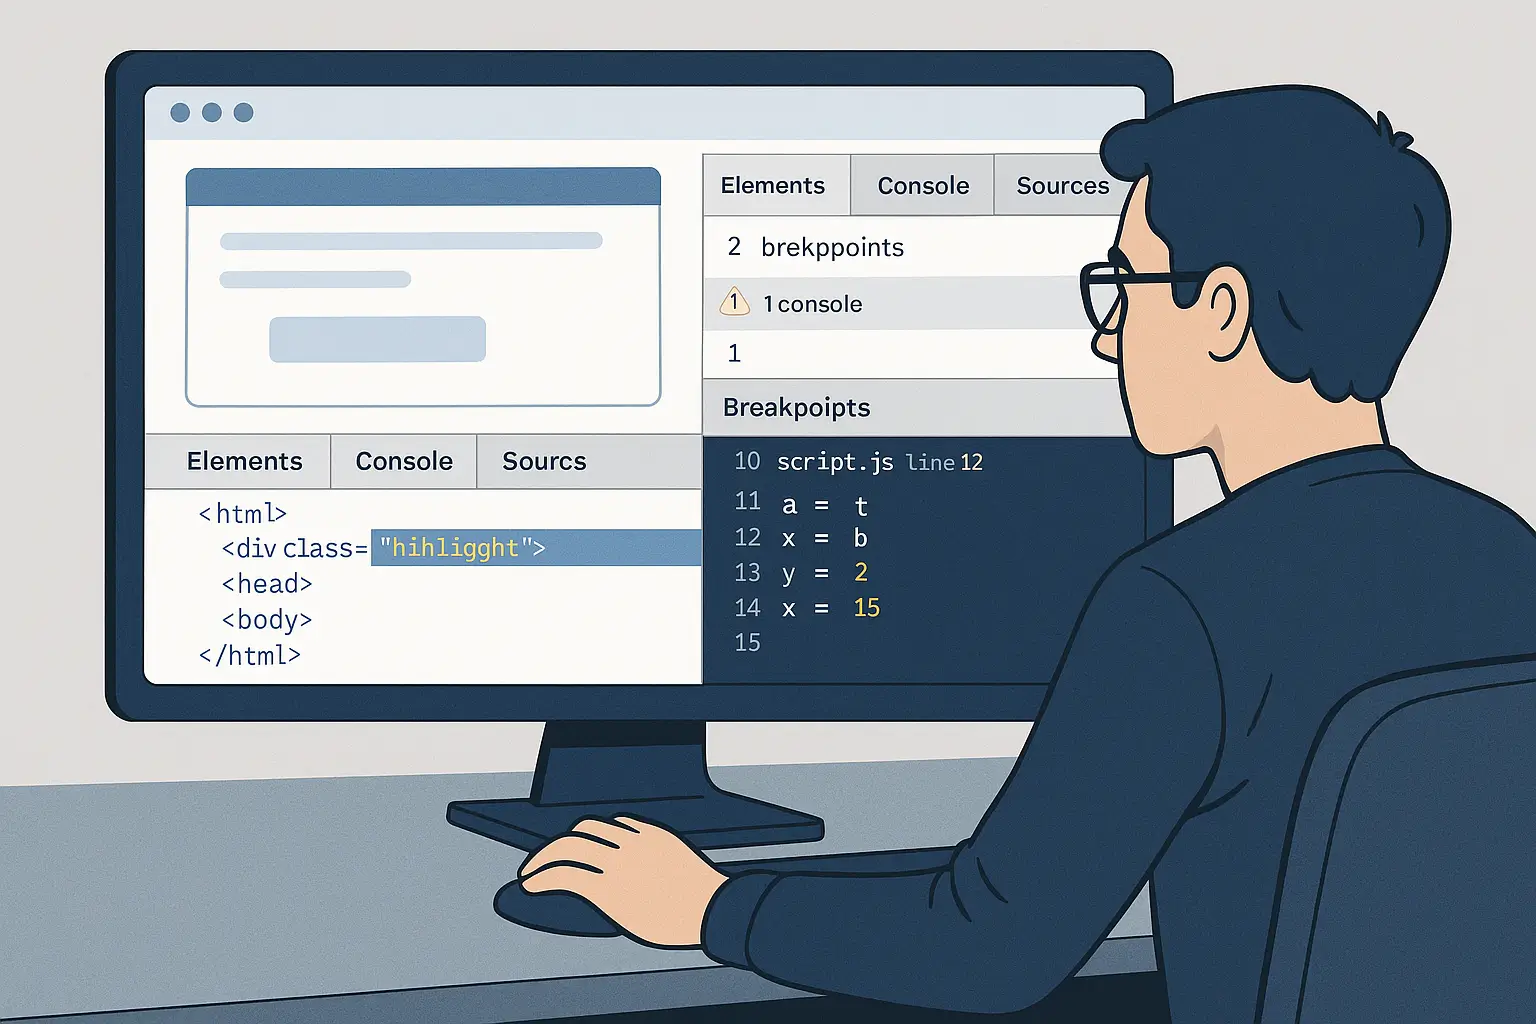
Web debugging tools are essential for any developer aiming to deliver fast, stable, and high-performing websites. Whether you’re building Shopify stores, WordPress themes, or React and Next.js applications, the right tools help you fix issues quickly and boost your workflow.
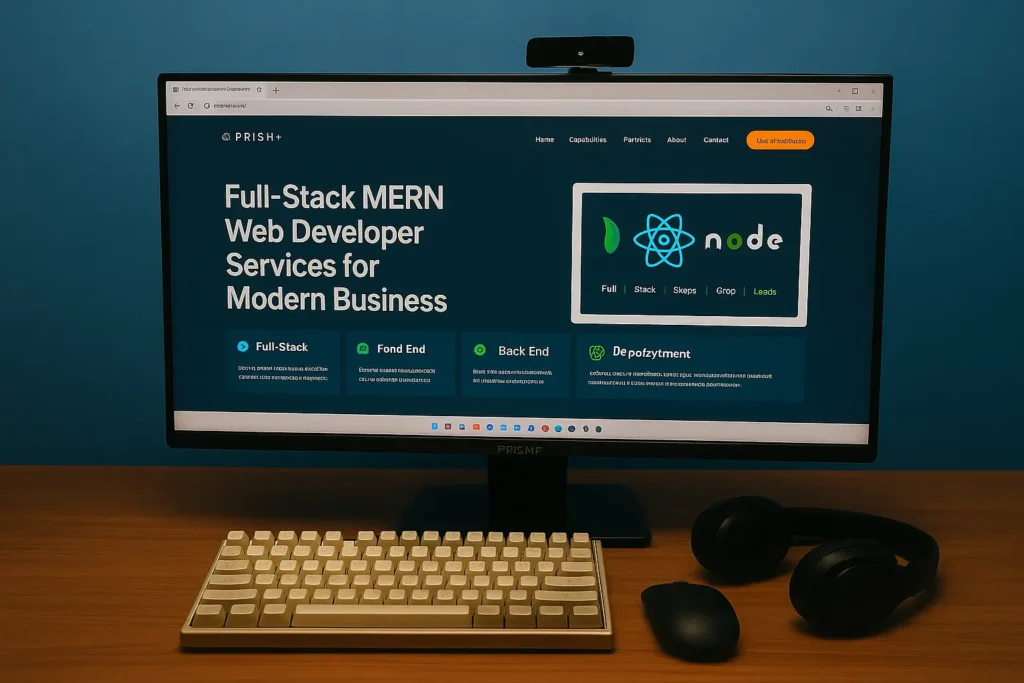
As a Full-Stack Developer at JacobAlmogela.com, I rely on these tools daily to ensure everything I build is polished, optimized, and error-free.
Why Web Debugging Tools Matter
1. Faster Problem Diagnosis
With web debugging tools, you can quickly find layout issues, script errors, failed requests, and performance bottlenecks.
External reference: Chrome DevTools Guide
2. Better Website Performance
These tools show you what slows down your site — large scripts, unused CSS, render-blocking resources, and more.
3. Improved Code Quality
Debuggers help eliminate bugs early, making your final product more stable and professional.
Top Web Debugging Tools Every Developer Should Use
Chrome DevTools
The most widely used tool for inspecting elements, debugging JavaScript, analyzing performance, and monitoring network requests.
Firefox Developer Tools
Offers advanced CSS grid visualization and responsive design checks.
React Developer Tools
Perfect for ReactJS and Next.js developers who want to track components and props.
Lighthouse
Used to audit performance, SEO, accessibility, and best practices.
Lighthouse Docs
How I Use Web Debugging Tools for Client Projects
On platforms like Shopify, WordPress, and custom applications, I use these tools to:
- Improve page speed
- Fix theme conflicts
- Clean up scripts
- Track errors
- Optimize user experience
- Ensure SEO readiness
If your business needs help, I offer performance optimization, debugging, redesign, and full rebuilds.
Visit my portfolio at JacobAlmogela.com

